Abstract
Accurate and early detection of anomalies in peripheral white blood cells plays a crucial role in the evaluation of well-being in individuals and the diagnosis and prognosis of hematologic diseases. For example, some blood disorders and immune system-related diseases are diagnosed by the differential count of white blood cells, which is one of the common laboratory tests. Data is one of the most important ingredients in the development and testing of many commercial and successful automatic or semi-automatic systems. To this end, this study introduces a free access dataset of normal peripheral white blood cells called Raabin-WBC containing about 40,000 images of white blood cells and color spots. For ensuring the validity of the data, a significant number of cells were labeled by two experts. Also, the ground truths of the nuclei and cytoplasm are extracted for 1145 selected cells. To provide the necessary diversity, various smears have been imaged, and two different cameras and two different microscopes were used. We did some preliminary deep learning experiments on Raabin-WBC to demonstrate how the generalization power of machine learning methods, especially deep neural networks, can be affected by the mentioned diversity. Raabin-WBC as a public data in the field of health can be used for the model development and testing in different machine learning tasks including classification, detection, segmentation, and localization.
Introduction
The issue of precise and early diagnosis is the most vital step in the medical treatment process. According to the World Health Organization, about 2 billion people currently do not have access to primary medical and pharmaceutical services1. In the meantime, laboratory tests play an essential role in the diagnosis and treatment of diseases. It is estimated that about 70% of the decisions related to the diagnosis and treatment of disease, as well as the discharge and admission of a patient, rely on the results of laboratory tests2. In this regard, the differential count of white blood cells is one of the common laboratory tests necessary to be considered in the diagnosis of various diseases such as blood disorders (such as leukemia, anemia, polycythemia, etc.) and immune system-related diseases (such as autoimmune anemias, allergy, etc.)3.
White blood cells called leukocytes include two groups of phagocytes and lymphocytes. While phagocytes comprise cells of the innate immune system and function rapidly after infection, lymphocytes mediate the acquired immune response. Phagocytes, themselves, can be divided into granulocytes (neutrophils, basophils, and eosinophils) and monocytes. In Table 1 and Fig. 1, you can see the characteristics and images of the five categories of white blood cells. Table 2 shows some examples of the diseases that occur with an increase or decrease in the number of white blood cells. For example, in allergic diseases, the number of basophils increases, or in blood malignancies, we can see an increase in the number of precursors of blood cells and changes in their shape and size. Therefore, determining the correct type and number of white blood cells is very important for diagnosing various diseases.
At present, manual (microscopic evaluation) and automated methods (using automatic hematology devices) are used to evaluate blood cells. Automated methods include devices which evaluate blood cells based on light scattering or electrical impedance such as Sysmex XP-300, Nihon Kohden Blood Cell Counter, and DH36 3-Part Auto Hematology Analyzer.
In electro-optical analyzers, a light-sensing detector measures the optical scattering. The size of the detected pulses corresponds to the size of the blood cells. Furthermore, in electrical impedance or Coulter principle cell counter, the passage of cells through an aperture in which an electric current is applied causes change in the electrical resistance. Pulses the height of which corresponds to the volume of the cell are counted, and this is considered as the basis of Coulter’s principle working4. Besides these methods, microscopic hyperspectral imaging technology, as an emerging imaging modality, is currently being used. This method is a combination of spectroscopy and 2D imaging6,7,8.
One of the serious drawbacks of these devices apart from their high cost is the simple act of counting cells without them being evaluated qualitatively from a structural and morphological point of view. As a result, after evaluating the blood sample by the mentioned cell counters, it is necessary to prepare a smear and evaluate it microscopically by the laboratory staff to achieve an accurate and correct diagnosis.
On the other hand, issues such as the lack of specialists and laboratory equipment, heavy workload, inexperience, and incorrect diagnosis affect the test results. Misdiagnosis affects the treatment regime, and consequently, can result in the malpractice and an increase of associated costs. However, the use of new technologies such as artificial intelligence and image processing allows quantitative and qualitative evaluations to improve the quality of diagnosis9.
Over the past 20 years, the techniques for automated imaging of the blood-stained slides have been introduced by computer-connected microscopes capable of assessing blood cell morphology. With the development of technology, companies such as Cellavision, Westmedica, Siemens, etc. have made it possible to differentiate the count of normal from abnormal blood cells10. In fact, today, deep neural networks are one of the most widely used machine learning methods for the classification and segmentation of medical images. Shahin, A et al.11 used DNNs to classify white blood cells. In addition, these networks are used for the classification of red blood cells to detect a sickle cell anemia12. Deep neural networks are also used for the segmentation of the pancreas in the CT scan images13,14 and the segmentation of the MRI images10.
Data have the most important role in the development of machine learning models. In order to train deep neural networks and increase their generalizability, we need a lot of diverse precise data and confident labels. The process of labeling medical data should be carried out by professionals and is, therefore, a time-consuming and challenging procedure. As a result, medical databases are of high significance in smartening medical diagnoses. Unfortunately, researchers, today, have limited access to a variety of medical data for various reasons. Examples of available medical image databases are15 and16. The database15 contains 82 3D CT scans in which the Grand Truths of the pancreas for all slices were manually extracted by medical students and finalized by a specialist radiologist. Camelyon16 is another dataset with 1399 whole-slide images of the lymph node smear samples with and without metastases, for which the labels were checked twice.
The morphological diversity of white blood cells is very high and in some cases, it is very challenging, even for an expert, to distinguish some classes from each other. On the other hand, many artificial intelligence articles have adopted two approaches to evaluate their proposed method regarding segmentation and classification of white blood cells: They have either collected small databases to the best of their ability17,18,19,20 or used the small databases available21,22,23. Therefore, a database with a large amount of diverse data and reliable labelling is truly necessary to evaluate and compare different methods with each other. Such a reference database will allow more artificial intelligence scientists to enter the field and will help the advancement of intelligence differentiation of white blood cells. The most important characteristics of the Raabin-WBC dataset that distinguishes it from similar datasets are as follows:
Large number of data: We tried to collect as much data as possible for each class in order for them to be appropriate for all machine learning techniques, especially deep learning. (Approximately 40,000 white blood cell images)
Precise labels: We considered more detailed labels than five types of white blood cells. In fact, labels contain the most important subgroup of each type. For example, we considered the meta and band which are subgroups of neutrophils and are valuable in diagnosis. In the next section, more information about the labels will be presented.
Double labeling: For more insurance, most of the cells are labeled by two experts.
Free public access: Since we aim at helping the development of artificial intelligence in hematology, the Raabin-WBC dataset is freely available for all.
Data cleaning: In the process of data collection, the existence of duplicate cell images is not inevitable. The first problem is that the duplicate cell images are not exactly the same. For example, there is a possibility of the cell being somewhat moved. The second issue is that having more than two versions of one cell image is also possible. Hence, we developed a fast graph-based image processing method that can accurately remove as many duplicate cells as possible. Despite this, it is still probable for some duplicate images to exist, albeit being significantly different.
The ground truths of nuclei and cytoplasm: The ground truths of the nuclei and cytoplasm are extracted for 1145 selected cells. In order to extract the ground truth of nuclei, we developed a toolkit that by using image processing techniques makes the ground truth extraction process much easier.
Diversity of the microscope and camera: Although most of the data were collected by a fixed type of microscope and camera, we collected some data with another type of camera and microscope, as well. In the section of experiments, you will see how new test data help to evaluate the generalization power of our trained models. In other words, the diversity of the dataset assists us in selecting a model that has correctly learned the manifold of cell images.
The rest of the paper is as follows: In “The characteristics of Raabin-WBC” section, we will elaborate more on the details regarding the dataset. In “Data collection” section, the data collection process will be explained completely. In “Experiments” section, we will do some machine learning experiments and discuss the generalization power of the models.
The characteristics of Raabin-WBC
In this section, more information is provided about the Raabin-WBC dataset. About 73 peripheral blood films were used for collecting this dataset. After imaging stained blood films, we tried to mine the most possible useful information from the raw data. For instance, the bounding box of all white blood cells and artifacts were extracted, cropped and labeled, successively. It is worth noting that a significant number of WBCs and artifacts were labeled by two experts. Furthermore, we provided the ground truth of the nucleus and cytoplasm for some of the cropped cells. The full details of the data collection steps are explained in Sect. 3. In Table 3, some general and useful information of the Raabin-WBC dataset is provided. Note that these numbers have been computed after the cleaning phase.
Labels
In the Raabin-WBC dataset, more detailed labels are considered than just five general types of white blood cells. For example, besides the mature neutrophil, we have evaluated two other ancestors of this white blood cell: Metamyelocytes and Band. An increase in the number of band forms and metamyelocytes is one of the features of reactive neutrophilia (an increase in the number of circulating neutrophils to levels greater than 7.5 × 10⁹/L)5. In addition, lymphocytes are divided into small (the main agents of the acquired immune system including B and T cells) and/or activated lymphocytes (activated small lymphocytes referred to as large lymphocytes or lymphoblasts). Bursts refer to smudge cells that are leukocyte remnants formed during blood smear preparation. Beside the leukocytes we considered drying artifacts as new labels, because artifacts are commonly seen after staining the samples. In Fig. 2, the diagram of the labels is presented.
In Table 4, the number of labels associated with two experts is shown. The rows and columns of the table belong to the first and second experts, respectively, noting that 9015 cells have not been labeled yet. We asked our experts to label the cells as unrecognizable if they had any doubts. Indeed, we have 1099 cells labeled as not recognized by the two experts. In Table 4, you can see the amount of disagreement for each pair of different labels (Non-diagonal elements of the matrix). For example, large and small lymphocytes are confused a lot. Also, seem bands have often been mistaken with mature neutrophils. Other examples of confusing pairs are artifact and burst, large lymphocyte and monocyte, and small lymphocyte and burst. The high numbers in the rows and columns labeled as not recognized indicate that it is very challenging to identify the type of white blood cell.
Data structure
The Raabin-WBC dataset consists of images that were taken from blood films (similar to Fig. 5). Corresponding to each microscopic image, a dictionary (.json format) file containing the following information about that image was provided:
Information about the blood elements in the image including their coordinates and labels. Most of the elements are labeled by two experts.
Information about the blood smears including staining method and the type of the disease. Note that all blood smears have been prepared from normal samples. Only a Chronic Myeloid Leukemia (CML) sample has been used to extract basophils.
Information about the microscope includes the type of microscope and its magnification size.
The type of camera used.
There is also a subset of the database called double-labeled Raabin-WBC which includes cropped images of the five main types of WBCs and were labeled the same by both of the experts. We will explain more about this sub-dataset in the experiment section.
Data collection
The data were collected from patients and the ethical approval was gotten from the ethical committee of Hematology, Oncology, and SCT Research center of Shariati hospital. We confirm that all methods were performed in accordance with the relevant guidelines and regulations. The steps of data collection (Fig. 3) include preparing blood smears and photographing them, extracting the bounding box of white blood cells, data cleaning, and finally labeling the data and extracting ground truths. More details are explained in the rest of this section.
Preparation of blood smears and imaging
72 normal peripheral blood films (male and female samples from ages 12 to 70) have been used to collect neutrophils, eosinophil, monocyte, and lymphocyte images. On the other hand, due to the very low presence of basophils in normal specimens (< 1–2%)9, basophils of one CML-positive sample have been imaged. Owing to the widespread use of Giemsa in medical labs9, all samples were stained by Giemsa. It should be noticed that all samples were taken from collaborator medical laboratories (Razi Hospital in Rasht, Gholhak Laboratory, Shahr-e-Qods Laboratory, and Takht-e Tavous Laboratory in Tehran, Iran) and we did not deal directly with patients. It is worth noting that in Iran, it is necessary to get the approval of patients only in clinical trials. But in retrospective studies, this is not necessary in Iran. The process of imaging the slides was performed by the help of two types of microscopes, namely Olympus CX18 and Zeiss at a magnification of 100×. Since determining the Diff area to evaluate and count different types of white blood cells is of utmost importance, an expert lab staff had supervised the cell imaging process.
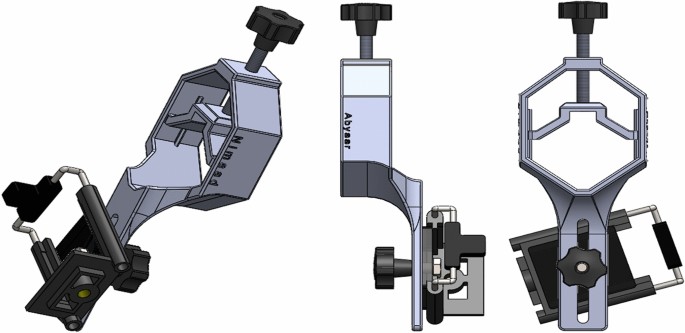
With smart phones being widely used in society, a rapidly growing trend has emerged to adapt them to medical diagnostics24,25. The availability, ease of use and low cost of high-pixel density cameras available in smart phones make them widely used in various science fields26,27,28,29,30,31,32. Therefore, in compiling this database, the cameras available on smart phones have been used, the details of which are given in Table 5. Smartphones can be adapted for microscopic imaging using some accessory equipment33,34,35. To facilitate the use of smart phones in microscopic imaging in this dataset, an adapter was designed and made by 3D printing to mount the smart phone on the microscope ocular lens (Fig. 4). The designed adapter has somewhat managed to minimize the drawbacks of the commercial models available in the market such as restrictions on the size of the phone and ocular lenses, as well as the difficulty of the adjustment.
Designed adapter to mount smart phones on the ocular lens of a microscope to make the act of capturing the photos from the samples quicker and easier. Experts work with a microscope manually and see the images on the mounted smartphone and take photos.
Extraction of white blood cells from images
In total, about 23,000 images were taken from blood films. There exist many red blood cells in each blood smear image. It is also probable that one or more other blood elements such as white blood cells and sometimes color spots exist in the image. The bounding box of these blood elements should be somehow identified. For this purpose, two approaches have been considered. Due to the distinct color of the nucleus in white blood cells, in the first approach, several white blood cells were extracted manually as Grand Truth data, and a color filter was trained to separate the white blood cells from the background. The aforementioned color filter was applied to the main images, and the approximate position of the white blood cells was marked. Finally, a 512 by 512 square with the center of the cell is considered as a bounding box. In the second approach, extracted bounding boxes with the help of the first approach were used, and a Faster RCNN network36, which can determine the exact location of the white blood cells in the original image, was trained. Eventually, about 43,000 blood elements were obtained.
Data cleaning
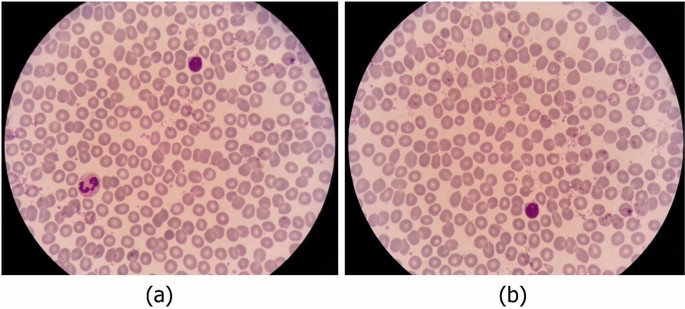
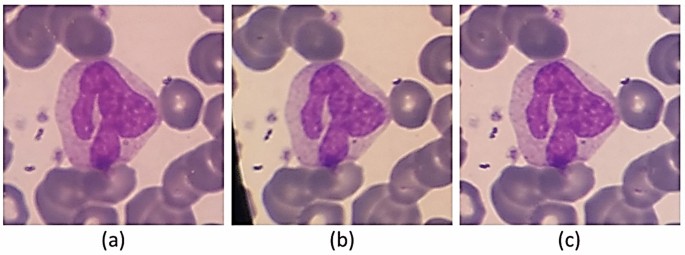
In the process of imaging from the blood smears, a white blood cell may be placed in more than one image (Fig. 5). Therefore, duplicate cell images exist among cropped images. The major problem is that the two images of one cell are not necessarily very similar. Consequently, a simple mean square error on the value of the pixels is not enough to detect duplicate cell images. Indeed, a cell can be repeated more than twice. In Fig. 6, an example of three images of one cell is represented. As you can see, the qualities of the three images are different.
Manual comparison of these images in pairs is practically impossible. Hence, an artificial intelligence algorithm, fast and accurate, has been developed to remove duplicate cell images. We used the Python ImageHash library, in this regard. First, for all pairs of cropped images, the Average Hash (AHash) and Perceptual Hash (PHash) values are calculated very quickly. Paired images, the AHash and PHash distances of which are less than those of the specific thresholds, are the same, and one of them should be removed. The thresholds of the Average Hash and Perceptual Hash are set manually through trial and error (See appendix 1 for more details).
Since an image may exist more than twice, a two-by-two comparison is not sufficient. For this purpose, a solution to the problem is presented from the Graph’s point of view. In fact, we have a graph with N nodes (N is the number of cropped cell images from blood film). There exist edges between the nodes that satisfy the sameness condition. In this case, the connected components of the graph form equal images. Connected components of a graph can be calculated with the help of the breadth-first search algorithm very swiftly (See appendix 2 for more details). If a connected component has n > 1 images, n − 1 of them must be removed. To enhance the quality of the database, the image with the highest resolution remains out of n images, and the rest are deleted. The OpenCV37 library is used to compare the resolution of images. In this regard, Sobel horizontal and vertical filters38 are applied to the images and the gradient magnitude is calculated for each pixel. Finally, the image with the highest average gradient magnitude is selected, because it is the sharpest one.
As described in Sect. 2, to offer full information, we provide our data in the format of large and not cropped images (like Fig. 5). For each large image, the coordinates and the labels of the containing cells are provided. We tried to remove as many duplicates as possible from large images. Indeed, we remove a large image in which all containing cells are inside another image. For example, in Fig. 5, image b is removed.
Labeling process
This section describes the labeling process, which involves determining the cell types and the ground truth of the nucleus and cytoplasm. As you can see in Table 1, the characteristics of the nucleus and cytoplasm can significantly affect determining the type of the cell. Some papers19,39 extract different features from the nucleus and the cytoplasm to classify white blood cells. These features usually describe the shape and the color of the nucleus and the cytoplasm.
Cell type labeling
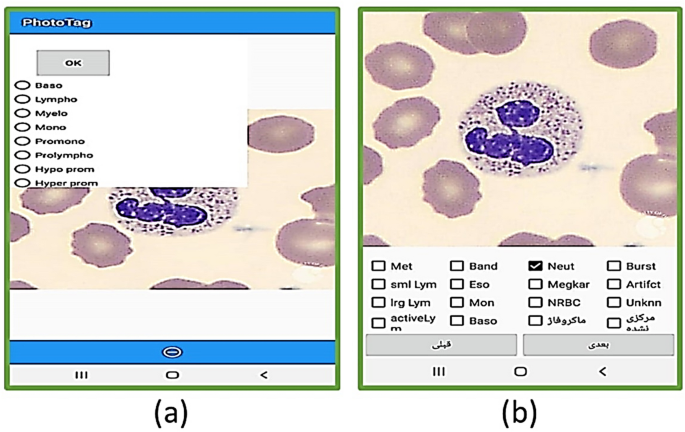
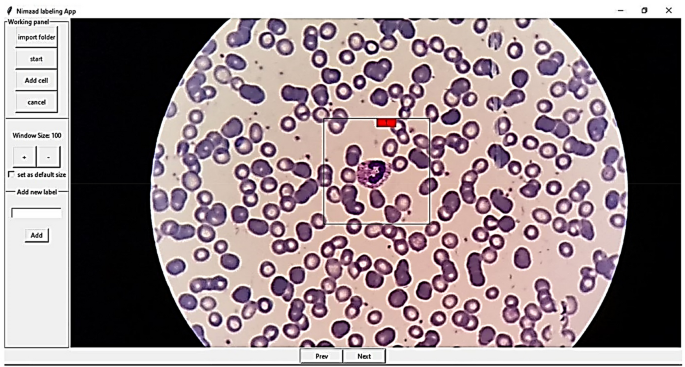
For labeling cells, two applications were developed for Android (Fig. 7). One application is for labeling cropped cells (Fig. 7-part b), and the other is for selecting the location and type of each cell (Fig. 7-part a). Furthermore, a desktop application with the help of the Python Tkinter library40 was developed for manually selecting the location and type of the cells (Fig. 8). It is worth mentioning that most of the images were labeled by two experts.
The user interface of the two android applications that were designed to selecting and labeling the white blood cells.
Ground truths of the nucleus and the cytoplasm
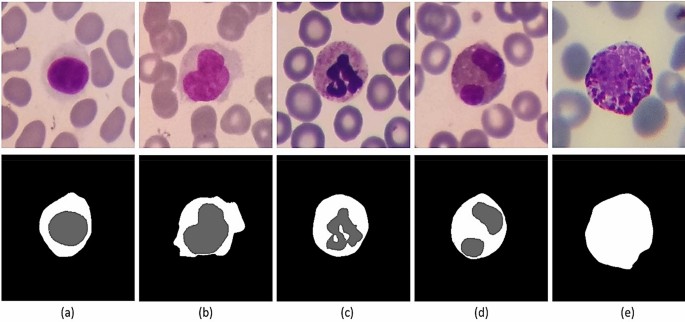
In recent years, many researchers have developed segmentation algorithms for the cytoplasm and nucleus of the white blood cells3,18,19,20,21,23. Hence, we tried to prepare the ground truths of the cytoplasm and the nucleus for a proper number of cropped white blood cells. For this purpose, 1145 cropped images including 242 lymphocytes, 242 monocytes, 242 neutrophils, 201 eosinophils, and 218 basophils were randomly selected, and their ground truths were extracted by an expert. It is worth mentioning that we only prepared the ground truth of the whole cell for basophils, and we were not able to produce the ground truths of the nucleus and cytoplasm for basophils. This is because the basophils are usually covered by very purple granules, and the border between cytoplasm and nucleus is not easily visible. Figure 9 shows some samples of the cells along with their ground truths.
Some samples of ground truths provided in the Raabin-WBC dataset. First row contains the original cropped images of white blood cells. Second row contains the ground truths of some nuclei and cytoplasm. The columns (a), (b), (c), (d), and (e) show lymphocyte, monocyte, neutrophil, eosinophil, and basophil, respectively.
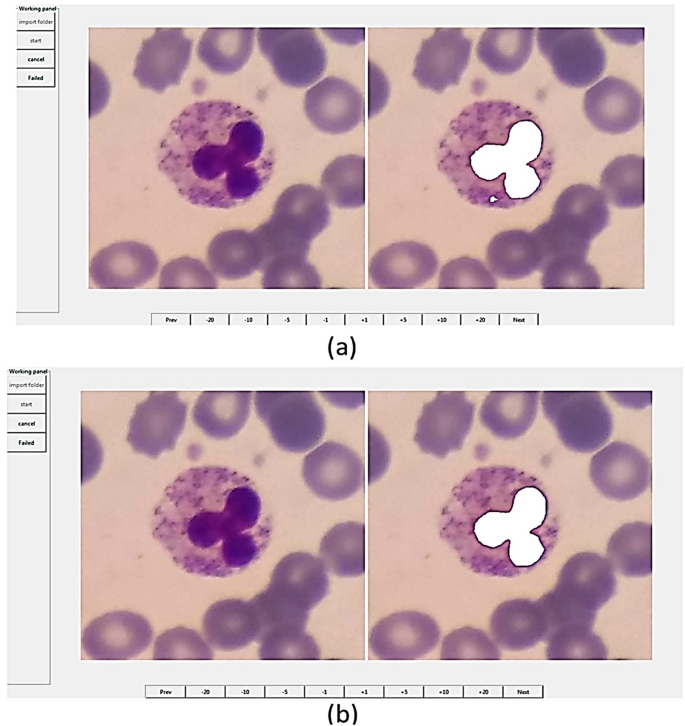
To produce the ground truths of nuclei, a newly published software called Easy-GT41 was employed. This software has been developed to extract the ground truths of nuclei. In Easy-GT software, a nucleus is determined by a relatively accurate segmentation method, and if necessary, the user can adjust the ground truth of the nucleus by modifying the final threshold41 (Fig. 10). In the segmentation process, the RGB image is first color-balanced41 and converted to the CMYK color space. Secondly, the two-class Otsu’s thresholding algorithm42 applied to the M channel gives us a threshold ( th2class
“>th2classth2class
). Again, the three-class Otsu thresholding algorithm is applied to the M channel and the two lower and upper thresholds ( thlow3class,thup3class
“>th3classlow,th3classupthlow3class,thup3class
) are extracted. Finally, the ultimate threshold value is obtained by computing the convex combination of th2class
“>th2classth2class
and thup3class
“>th3classupthup3class
.
The user interface of Easy-GT software41. This software was developed for extracting the ground truths of nuclei in white blood cells.
To make the ground truth of the cytoplasm, a light pen was used, and the ground truth of the whole cell was specified by an expert. Finally, by removing the nucleus part obtained from Easy-GT, only the cytoplasm remains.
Experiments
In this section, we are going to do some machine learning experiments on the Raabin-WBC data. Due to the diversity of information in the database, many research lines can be developed. Yet, we consider the most common possible experiment. We classify five classes of white blood cells, and we leave the rest to those who are interested in this field. For this purpose, we used the double-labeled cropped cells and considered only five main classes including mature neutrophils, lymphocytes (small and large), eosinophils, monocytes, and basophils. We called this sub-dataset Double-labeled Raabin-WBC. In the following, we will compare this database with some existing 5-class databases and train some deep popular neural networks. We will also discuss the generalization power of the models.
A comparison with similar datasets
Various datasets of normal peripheral blood with different properties exist, but in general, most of them have a small number of samples. This is due to the fact that in the medical field, data collection and labeling are complicated. On the other hand, in the field of Hematology, artificial intelligence models are usually sensitive to some specifications of the dataset such as the number of data, the staining technique, the microscope and camera used, and the magnification. So, by altering the aforementioned characteristics, the accuracy of the models may be reduced. In Table 6, the characteristics of some datasets are presented and compared with Double-labeled Raabin-WBC. As you can see, our database is far better in several ways including data number, label assurance, ground truth, camera, and microscope variety. Most importantly, this database is available to everyone for free.
Utilized models
Some popular pre-trained deep neural networks were trained on Double-labeled Raabin-WBC to classify five types of white blood cells. VGG1643 is the oldest CNN model consists of alternating convolutional and pooling layers. From deep residual network families, Resnet1844, Resnet3444, Resnet5044, and Resnext5045 were tested. In Resnet architecture, identity shortcut connections that skip one or more layers are used44. Resnext is an extension of Resnet in which the residual block is replaced by a new aggregation component45. In mentioned aggregation component, the input feature map is projected to some lower-dimensional representations, and their outputs are aggregated45. Another CNN used in the experiments is DenseNet12146 which consists of dense blocks. At each dense block, each layer is fed from all previous layers, and its outputs are transferred to all next layers.
Another tested deep architecture is MobileNet-V247 which is suitable for mobile devices. The building block of MobileNet-V2 is an inverted residual block, and non-linearities are removed from narrow layers. MnasNet148 and ShuffleNet-V249 are other light-weight CNNs for mobile devices. In MnasNet, reinforcement learning is employed to find an efficient architecture48. In ShuffleNet-V249 at the beginning of the basic blocks, a split unit divides the input channels into two branches, and at the end of the block, concatenation and channel shuffling occur. Besides the aforementioned neural networks, we also utilized a feature-based method50 in which the nucleus was segmented at first, and its convex hull was then obtained. After that, shape and color features were extracted using the segmented nucleus and its convex hull. Finally, WBCs were categorized by an SVM model.
Classification results
The generalization power of the models described in the former section is to be examined at two levels. For this purpose, we split data into three groups of training data, test-A, and test-B, the properties of which can be observed in Table 7. The quality of the images in the test-A dataset is similar to that of the training dataset, but the images in the test-B dataset have different qualities in terms of camera type and microscope type. Unfortunately, the test-B data only contains double-labeled neutrophils and lymphocytes.
The training data are not balanced, in other words, the number of cells in each class is imbalanced. Hence, the training set was augmented and moderated using augmentation methods such as horizontal flip, vertical flip, rescaling, and a combination of them. In order to evaluate the models, four metrics are considered for each class: precision (P), sensitivity (S), F1-score, and accuracy (Acc). The aforementioned criteria are obtained through the Eqs. (1), (2), (3), and (4).
Precision=TPTP+FP
“>Precision=TPTP+FPPrecision=TPTP+FP
Sensitivity=TPTP+FN
“>Sensitivity=TPTP+FNSensitivity=TPTP+FN
F1=2×Prec×SensPrec+Sens
“>F1=2×Prec×SensPrec+SensF1=2×Prec×SensPrec+Sens
Acc=TP+TNTP+FP+TN+FN
“>Acc=TP+TNTP+FP+TN+FNAcc=TP+TNTP+FP+TN+FN
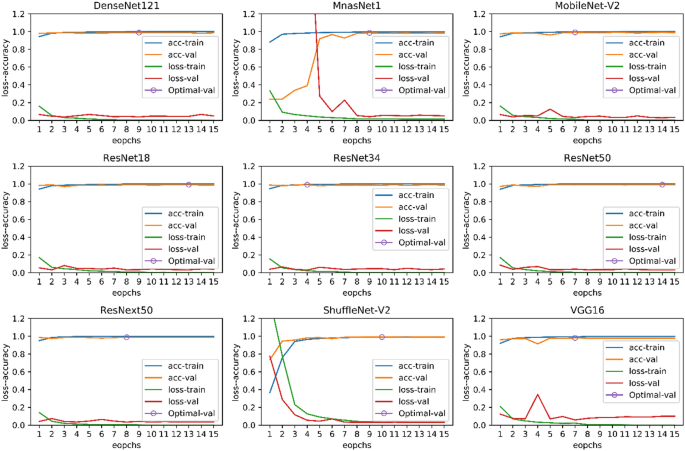
In Eqs. 1–4, TP, FP, TN, and FN are true positive, false positive, true negative, and false negative, respectively. In Tables 8 and 9, the results on the test-A and test-B datasets are presented. Also, in the last row of Tables 8 and 9, the results of the feature-based classification presented in the paper50 are showed. In Fig. 11, the plots of the accuracy and the loss of training data and validation data related to nine pre-trained models are shown.
The plots of the accuracy and loss of training data and validation data related to nine pre-trained models.
The results are surprising, and all methods have an acceptable outcome on the test-A data. Yet, the performance of most of the models on the test-B data experience a dramatic decrease. The feature-based method50 had the least performance reduction, despite having the lowest accuracy on the test-A data. Among deep neural networks, the VGG1643 network has relatively more generalizability. It can be said that the feature-based method could extract more meaningful features from cell images than the deep neural networks. If we had not tested the models on the test-B data, we would have thought that we have trained a strong classification model; yet, this was not the case. In this experiment, we do not want to conclude that deep neural networks have less generalization power than feature-based methods. If we applied some appropriate pre-processing on the images before training or used some smarter image augmentation methods, the performance of deep neural networks would be better. In this experiment, you can easily understand the role of the dataset in the training of machine learning models.
All training processes were carried out using a single NVIDIA GeForce RTX 2080 Ti graphic card and were handled by Python 3.6.9 and Pytorch library version 1.5.1. We considered 15 epochs for the training process and the starting learning rate, and the batch size were 0.001 and 10, respectively. The learning rate was decayed by the ratio of 0.1 and step size 7. Stochastic gradient descent was utilized as the optimization method. We used the Torchvision library in order to load pre-trained networks on the ImageNet dataset51. The output size of the last linear layer was changed from 1000 to 5.
Conclusion
By evaluating the peripheral white blood cells, a wide range of benign diseases such as anemia and malignant ones such as leukemia can be detected. On the other hand, early detection of some of these abnormalities, such as acute lymphoid leukemia, despite its lethality, can help its treatment process. Therefore, it is important to adopt methods that can be effective in the early detection of different diseases. The role of machine learning methods in intelligent medical diagnostics is becoming more and more prominent these days. Indeed, deep neural networks are revolutionizing the medical diagnosis process and are considered as one of the stare-of-the-arts.
Since deep neural networks usually have a huge number of training parameters, the overfitting problem is not highly unlikely. Therefore, the diversity of training data is necessary and cannot be ignored. In medical diagnostics, in particular, this diversity gets bolder, because the medical devices can be very diverse. For example, in the field of hematology, the type of microscope and camera is very influential. To this end, we collected a huge free available dataset of white blood cells from normal peripheral blood so as to relatively satisfy the mentioned diversity. This multipurpose dataset can serve as a reference dataset for the evaluation of different machine learning tasks such as classification, detection, segmentation, and localization.
Data availability
The Raabin-WBC dataset is publicly available through the following link: https://www.raabindata.com/free-data/.
References
- Ten years in public health, 2007–2017: Report by Dr Margaret Chan, Director-General, World Health Organization (2017).
- Serio, L. Importance of clinical lab testing highlighted during medical lab professionals week. http://www.acla.com/importance-of-clinical-lab-testing-highlighted-during-medical-lab-professionals-week/ (2014).
- Putzu, L., Caocci, G. & Di Ruberto, C. Leucocyte classification for leukaemia detection using image processing techniques. Artif. Intell. Med. 62, 179–191 (2014).
- McPherson, R. A. Henry’s Clinical Diagnosis and Management by Laboratory Methods: First South Asia Edition_e-Book (Elsevier, 2017).
- Hoffbrand, A. V. & Steensma, D. P. Hoffbrand’s Essential Haematology (Wiley, 2019).
- Wang, Q., Wang, J., Zhou, M., Li, Q. & Wang, Y. Spectral-spatial feature-based neural network method for acute lymphoblastic leukemia cell identification via microscopic hyperspectral imaging technology. Biomed. Opt. Express 8, 3017–3028 (2017).
- Lu, G. & Fei, B. Medical hyperspectral imaging: A review. J. Biomed. Opt. 19, 1–24 (2014).
- Mehdorn, M. et al. Hyperspectral imaging (HSI) in acute mesenteric ischemia to detect intestinal perfusion deficits. J. Surg. Res. 254, 7–15 (2020).
- Bain, B. J., Bates, I. & Laffan, M. A. Dacie and Lewis Practical Haematology E-Book: Expert Consult: Online and Print (Elsevier Health Sciences, 2016).
- Avendi, M. R., Kheradvar, A. & Jafarkhani, H. A combined deep-learning and deformable-model approach to fully automatic segmentation of the left ventricle in cardiac MRI. Med. Image Anal. 30, 108–119 (2016).
- Shahin, A. I., Guo, Y., Amin, K. M. & Sharawi, A. A. White blood cells identification system based on convolutional deep neural learning networks. Comput. Methods Programs Biomed. 168, 69–80 (2019).
- Xu, M. et al. A deep convolutional neural network for classification of red blood cells in sickle cell anemia. PLOS Comput. Biol. 13, 1–27 (2017).
- Oktay, O. et al. Attention u-net: Learning where to look for the pancreas. arXiv 2018. arXiv Preprint arXiv:1804.03999 (2018).
- Roth, H. R. et al. DeepOrgan: Multi-level deep convolutional networks for automated pancreas segmentation. In Medical Image Computing and Computer-Assisted Intervention 556–564 (2015).
- Roth, H. R. et al. Data from pancreas-CT. Cancer Imaging Arch. https://doi.org/10.7937/K9/TCIA.2016.tNB1kqBU (2016).
- Litjens, G. et al. 1399 H&E-stained sentinel lymph node sections of breast cancer patients: The CAMELYON dataset. Gigascience https://doi.org/10.1093/gigascience/giy065 (2018).
- Labati, R. D., Piuri, V. & Scotti, F. All-IDB: The acute lymphoblastic leukemia image database for image processing. In IEEE International Conference on Image Processing 2045–2048 (2011).
- Mohamed, M., Far, B. & Guaily, A. An efficient technique for white blood cells nuclei automatic segmentation. In IEEE International Conference on Systems, Man, and Cybernetics 220–225 (2012).
- Sarrafzadeh, O., Rabbani, H., Talebi, A. & Banaem, H. U. Selection of the best features for leukocytes classification in blood smear microscopic images. In Medical Imaging 2014: Digital Pathology, Vol. 9041 159–166 (SPIE, 2014).
- Rezatofighi, S. H. & Soltanian-Zadeh, H. Automatic recognition of five types of white blood cells in peripheral blood. Comput. Med. Imaging Graph 35, 333–343 (2011).
- Zheng, X., Wang, Y., Wang, G. & Liu, J. Fast and robust segmentation of white blood cell images by self-supervised learning. Micron 107, 55–71 (2018).
- Habibzadeh, M., Jannesari, M., Rezaei, Z., Baharvand, H. & Totonchi, M. Automatic white blood cell classification using pre-trained deep learning models: ResNet and inception. In International Conference on Machine Vision, Vol. 10696. 274–281 (SPIE, 2018).
- Andrade, A. R. et al. Recent computational methods for white blood cell nuclei segmentation: A comparative study. Comput. Methods Programs Biomed. 173, 1–14 (2019).
- West, D. How mobile devices are transforming healthcare. Issues Technol. Innov. 18, 1–11 (2012).
- Ozcan, A. Mobile phones democratize and cultivate next-generation imaging, diagnostics and measurement tools. Lab Chip 14, 3187–3194 (2014).
- Kim, H. et al. Smartphone-based low light detection for bioluminescence application. Sci. Rep. 7, 40203 (2017).
- Majumder, S. & Deen, M. J. Smartphone sensors for health monitoring and diagnosis. Sensors 19, 2164 (2019).
- Mochida, K. et al. Computer vision-based phenotyping for improvement of plant productivity: A machine learning perspective. Gigascience https://doi.org/10.1093/gigascience/giy153 (2018).
- Wei, Q. et al. Detection and spatial mapping of mercury contamination in water samples using a smart-phone. ACS Nano 8, 1121–1129 (2014).
- Breslauer, D. N., Maamari, R. N., Switz, N. A., Lam, W. A. & Fletcher, D. A. Mobile phone based clinical microscopy for global health applications. PLoS ONE 4, 1–7 (2009).
- Martinez, A. W. et al. Simple telemedicine for developing regions: Camera phones and paper-based microfluidic devices for real-time, off-site diagnosis. Anal. Chem. 80, 3699–3707 (2008).
- Mudanyali, O. et al. Integrated rapid-diagnostic-test reader platform on a cellphone. Lab Chip 12, 2678–2686 (2012).
- Tseng, D. et al. Lensfree microscopy on a cellphone. Lab Chip 10, 1787–1792 (2010).
- Contreras-Naranjo, J. C., Wei, Q. & Ozcan, A. Mobile phone-based microscopy, sensing, and diagnostics. IEEE J. Sel. Top. Quantum Electron. 22, 1–14 (2016).
- Roy, S. et al. Smartphone adapters for digital photomicrography. J. Pathol. Inform. 5, 24 (2014).
- Ren, S., He, K., Girshick, R. & Sun, J. Faster R-CNN: Towards real-time object detection with region proposal networks. IEEE Trans. Pattern Anal. Mach. Intell. 39, 1137–1149 (2017).
- Bradski, G. The opencv library. Dr Dobb’s J. Softw. Tools 25, 120–125 (2000).
- Duda, R. O. & Hart, P. E. Pattern Classification and Scene Analysis Vol. 3 (Wiley, 1973).
- Hegde, R. B., Prasad, K., Hebbar, H. & Singh, B. M. K. Development of a robust algorithm for detection of nuclei and classification of white blood cells in peripheral blood smear images. J. Med. Syst. 42, 110 (2018).
- Van Rossum, G. The Python Library Reference, release 3.8. 2. Python Softw. Found. 36 (2020).
- Kouzehkanan, S.-Z. M., Tavakoli, I. & Alipanah, A. Easy-GT: Open-source software to facilitate making the ground truth for white blood cells nucleus. arXiv preprint arXiv:2101.11654 (2021).
- Otsu, N. A threshold selection method from gray level histograms. IEEE Trans. Syst. Man. Cybern. 9, 62–66 (1979).
- Simonyan, K. & Zisserman, A. Very deep convolutional networks for large-scale image recognition. arXiv Preprint. arXiv:1409.1556 (2014).
- He, K., Zhang, X., Ren, S. & Sun, J. Deep residual learning for image recognition. In IEEE Conference on Computer Vision and Pattern Recognition 770–778 (2016).
- Xie, S., Girshick, R., Dollár, P., Tu, Z. & He, K. Aggregated residual transformations for deep neural networks. In IEEE Conference on Computer Vision and Pattern Recognition 1492–1500 (2017).
- Huang, G., Liu, Z., Van Der Maaten, L. & Weinberger, K. Q. Densely connected convolutional networks. In IEEE Conference on Computer Vision and Pattern Recognition 4700–4708 (2017).
- Sandler, M., Howard, A., Zhu, M., Zhmoginov, A. & Chen, L.-C. Mobilenetv2: Inverted residuals and linear bottlenecks. In IEEE Conference on Computer Vision and Pattern Recognition 4510–4520 (2018).
- Tan, M. et al. Mnasnet: Platform-aware neural architecture search for mobile. In IEEE Conference on Computer Vision and Pattern Recognition 2820–2828 (2019).
- Ma, N., Zhang, X., Zheng, H.-T. & Sun, J. Shufflenet v2: Practical guidelines for efficient CNN architecture design. In European Conference on Computer Vision 116–131 (2018).
- Tavakoli, S., Ghaffari, A., Mousavi Kouzehkanan, S.-Z. & Hosseini, R. New segmentation and feature extraction algorithm for the classification of white blood cells in peripheral smear images. Sci. Rep. 11, 19428. https://doi.org/10.1038/s41598-021-98599-0 (2021).
- Deng, J. et al. ImageNet: A large-scale hierarchical image database. In IEEE Conference on Computer Vision and Pattern Recognition 248–255 (2009).
Acknowledgments
The authors would like to thank the laboratory of Razi Hospital in Rasht, Gholhak laboratory, Shahr-e-Qods laboratory and, Takht Tavous laboratory in Tehran for their efforts in collecting samples of the dataset. Ms. Anahita Ahouraei and Mr. Arman Yekta are also to be appreciated for the efforts they put in editing the Raabin database contract as our attorneys at law. The authors would like to acknowledge the financial support of University of Tehran Science and Technology Park for this research under Grant Number 130067, as well.
Author information
Author notes
These authors contributed equally: Zahra Mousavi Kouzehkanan and Sepehr Saghari.
Affiliations
School of ECE, College of Engineering, University of Tehran, Tehran, Iran
Zahra Mousavi Kouzehkanan, Mohammadjavad Abaszadeh & Reshad Hosseini
Nimaad Health Equipment Development Company, Tehran, Iran
Zahra Mousavi Kouzehkanan, Sepehr Saghari, Sajad Tavakoli, Peyman Rostami, Farzaneh Mirzadeh & Esmaeil Shahabi Satlsar
Graduated Bachelor of Laboratory of Sciences, Paramedical Faculty of Guilan, University of Medical of Sciences, Langarud, Gilan, Iran
Sepehr Saghari
Faculty of Electrical Engineering, K. N. Toosi University of Technology, Tehran, Iran
Sajad Tavakoli
School of Mechanical Engineering, Sharif University of Technology, Tehran, Iran
Peyman Rostami
School of Medicine, Tarbiat Modares University, Tehran, Iran
Farzaneh Mirzadeh
Flow Cytometry Department, Takhte Tavous Patobiology Lab, Tehran, Iran
Esmaeil Shahabi Satlsar
Department of Hematology and Blood Transfusion, School of Allied Medical Sciences, Iran University of Medical Sciences, Tehran, Iran
Maryam Gheidishahran
Bachelor of Laboratory of Sciences, Faculty of Paramedical, Mashhad University of Medical Sciences, Mashhad, Iran
Fatemeh Gorgi
Hematology-Oncology and Stem Cell Transplantation Research Center, Tehran University of Medical Sciences, Tehran, Iran
Saeed Mohammadi
Contributions
Z.M.K. is the main author and the supervisor and executor of the artificial intelligence and image processing parts. S.S. is also the main author and the head of the medical and data collection department. S.T. and P.R. helped with manuscript revision and data collection. M.A., F.M., E.S.S., M.G., F.G., and S.M. have helped with the data collection and labeling process. R.H. is the advisor of the team and the corresponding author.
Corresponding author
Correspondence to Reshad Hosseini.
Ethics declarations
Competing interests
Raabin-WBC dataset has been compiled under the supervision of Nimaad Health Equipment Development Company. The authors and the company declare no competing interests.
Additional information
Publisher’s note
Springer Nature remains neutral with regard to jurisdictional claims in published maps and institutional affiliations.
Supplementary Information
Rights and permissions
Open Access This article is licensed under a Creative Commons Attribution 4.0 International License, which permits use, sharing, adaptation, distribution and reproduction in any medium or format, as long as you give appropriate credit to the original author(s) and the source, provide a link to the Creative Commons licence, and indicate if changes were made. The images or other third party material in this article are included in the article’s Creative Commons licence, unless indicated otherwise in a credit line to the material. If material is not included in the article’s Creative Commons licence and your intended use is not permitted by statutory regulation or exceeds the permitted use, you will need to obtain permission directly from the copyright holder. To view a copy of this licence, visit http://creativecommons.org/licenses/by/4.0/.


